Water applied
Per field, per block, per pivot — totals by day, week, month, or season.
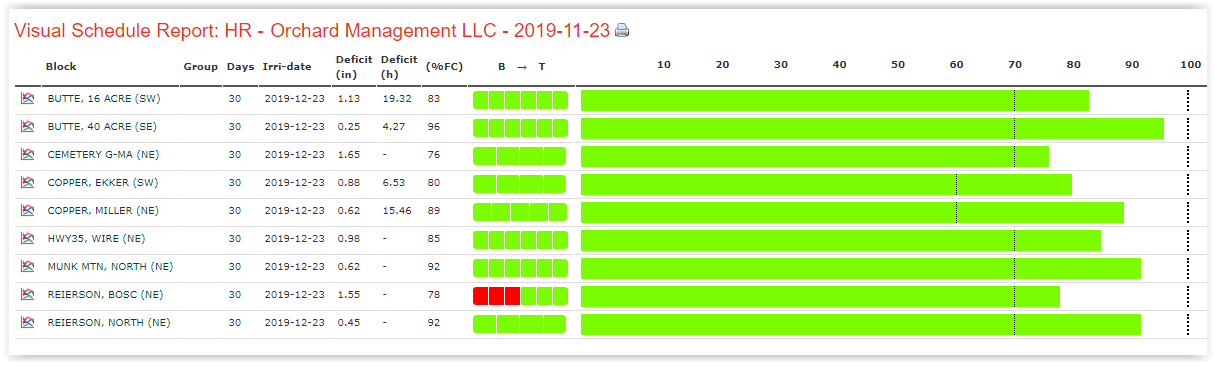
Every farm needs a paper trail. Reports turn a season of probe and meter data into the summaries auditors, accountants, and farm managers actually use.
Per field, per block, per pivot — totals by day, week, month, or season.
Average and range by depth, with the share of time spent inside the working band.
Reference ET against actual application — see how the water budget tracks across the season.
Every start, stop, and run-time, with flow meter totals where available.
One click to a printable PDF, or CSV for your own analysis and accounting tools.
Have weekly summaries land in your inbox automatically — no logging in required.
If your auditor or co-op expects a particular layout, we can usually match it.
Talk to us