Farms & field outlines
Draw or import field boundaries; group by farm, block, or cultivar.
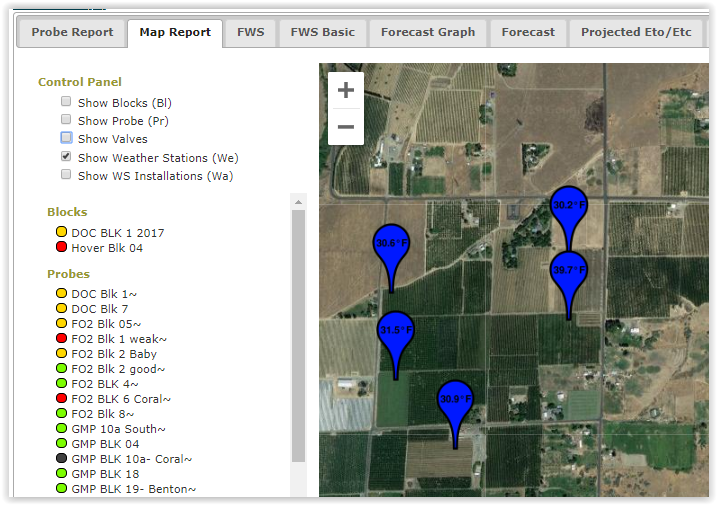
Some questions are easier to answer on a map than on a graph. The map view lays out farms, fields, and sensors over satellite imagery so position and proximity stay obvious.
Draw or import field boundaries; group by farm, block, or cultivar.
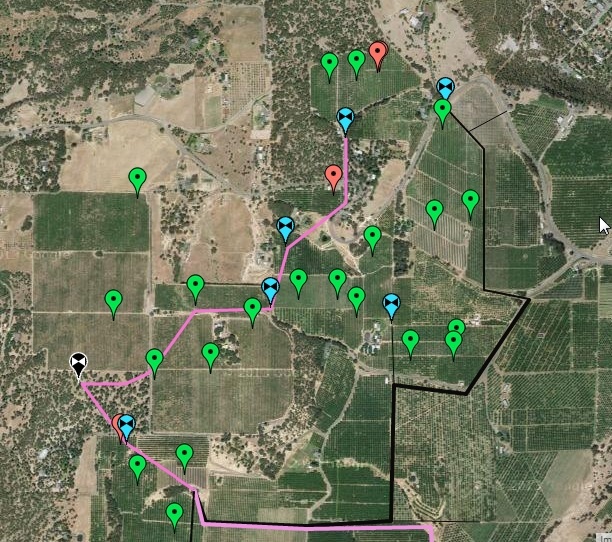
Every probe, flow meter, and weather station shown in place, with status colours at a glance.
Tap a pin for the latest reading; open the full graph in a single click.
Overlay recent rainfall from on-farm gauges or regional sources to spot uneven coverage.
Drop proposed sensor positions on the map and walk them in with GPS during installation.
Switch base layers to suit the question — terrain for runoff, satellite for canopy.
If you already work in QGIS or another GIS tool, we can import your shapefiles.
Get in touch