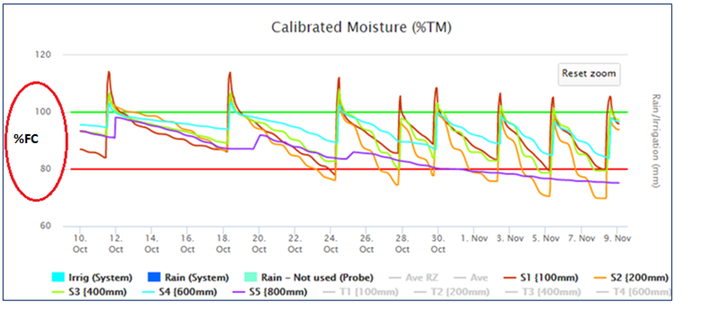
Soil moisture by depth
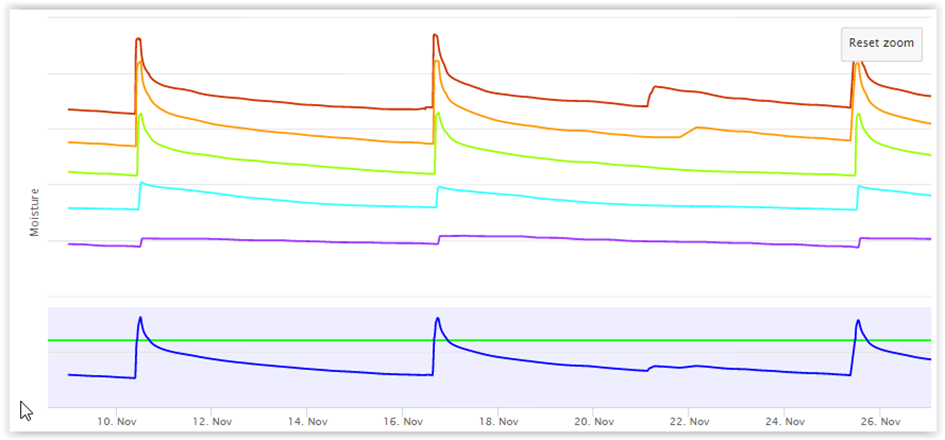
Each probe depth on its own line, so you can see exactly where the wetting front is and how the root zone is drawing down.
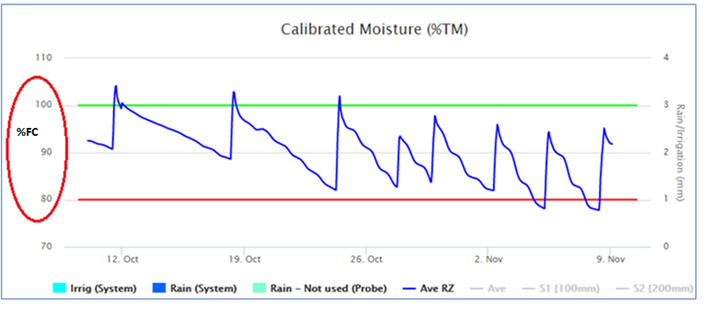
The graph view is where most decisions get made. It plots every probe, every depth, alongside irrigation events, rainfall, and reference ET — so the picture is always complete.
Each probe depth on its own line, so you can see exactly where the wetting front is and how the root zone is drawing down.
Match every spike to an event. Confirm an irrigation actually reached the deeper sensors; spot a missed cycle.
Reference ET from the nearest station overlays moisture, so you can read demand against supply.
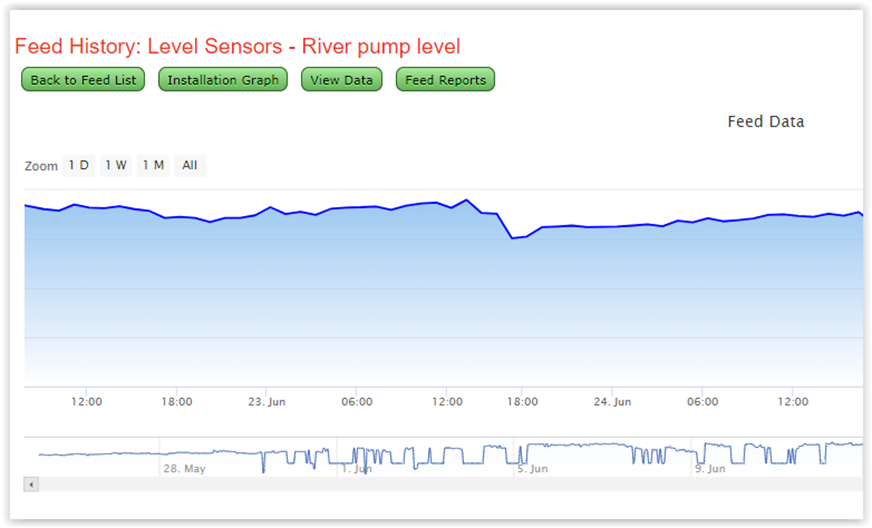
Drag to inspect a day, a week, or the whole season. Compare the same window across years.
Pull two probes onto the same chart to compare blocks, cultivars, or irrigation strategies side by side.
Mark events, leave notes, and share a link with your agronomist or farm manager.
We can give you a guided demo using sample fields, or set up a trial on yours.
Request a demo