Cumulative pressure
A running tally of conducive hours and infection events over the season — at a glance, is this a high-pressure year?
One bad week does not make a season. The disease index view aggregates day-by-day pressure into a running score, so you can see how the season is tracking against last year and the long-term average.
A running tally of conducive hours and infection events over the season — at a glance, is this a high-pressure year?
Lay this season against last and a long-term mean, so anomalies stand out early.
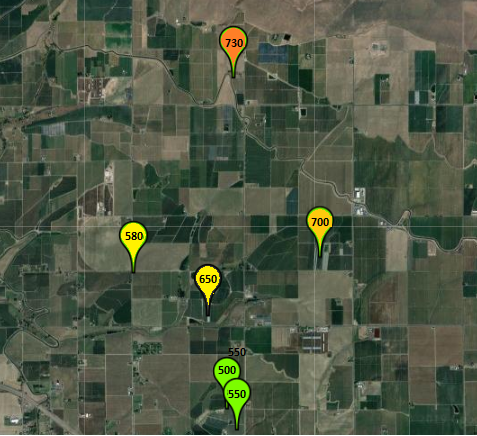
Indices roll up per block where on-farm weather supports it, surfacing internal variation.
Set thresholds at which you would normally adjust the programme; flags trigger when crossed.
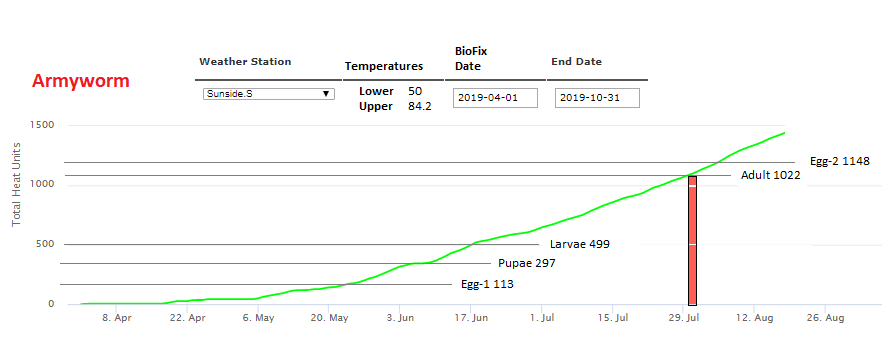
Plot index against spray dates to evaluate how programmes performed under the pressure they actually faced.
End-of-season export for post-mortems with your agronomist or pack-house.
If you have weather data for last season, we can run the index retrospectively as a worked example.
Request a replay